Net Earnings: Increased 9.4% to $1.25 billion
Revenue: Increased 2.5% to $5.57 billion
Operating Income: Increased 2.3% to $1.78 billion
Operating Expenses:Increased 2.5% to $3.79 billion
Operating Ratio: Improved by 2 points to 66.5%
Click here to read BNSF’s full earnings report.
Net Earnings: Increased 6% to C$786 million from C$741 million
Earnings Per Share: Diluted earnings per share increased 8% to C$1.08 from C$1.00 and adjusted diluted EPS increased by 17% to C$1.17
Revenue: Increased by 11% to C$3.5 billion from C$3.2 billion
Operating Income: Increased 5% to C$1.08 billion from C$1.03 billion
Operating Expenses: Increased 14% to C$2.5 billion from C$2.2 billion
Operating Ratio: Worsened by 1.7 points to 69.5%; Adjusted operating ratio improved 0.6 points to 67.2%
Click here to read CN’s full earnings report.
Net Earnings: Increased 25% to C$434 million from C$348 million
Earnings Per Share: Diluted earnings per share increased 28% to $3.09 from $2.41; adjusted diluted earnings per share increased 3% to $2.79 from $2.70
Revenue: Increased 6% to C$1.77 billion from C$1.66 billion
Operating Income: Increased 1% to C$543 million from C$540 million
Operating Expenses: Increased 9% to C$1.2 billion from C$1.1 billion
Operating Ratio: Worsened 180 basis points to 69.3% from 67.5%
Click here to read CP’s full earnings report.
Net Earnings: Increased 20% to $834 million from $695 million
Earnings Per Share: Increased 31% to $1.02 from $0.78 per share
Revenue: Increased 5% to $3.01 billion from $2.9 billion
Operating Income: Increased 17% to $1.22 billion from $1.04 billion
Operating Expenses: Decreased 2% to $1.79 billion from $1.83 billion
Operating Ratio: Improved to a first quarter record of 59.5% from 63.7%
Click here to read CSX’s full earnings report.
Net Earnings: Decreased to $103.2 million from $145 million
Earnings Per Share: Decreased 27% to $1.02 from $1.40; adjusted diluted earnings per share increased 18% to $1.54 from $1.30
Revenue: Increased 6% to a record $675 million from $639 million
Operating Income: Decreased to $160.3 million from $219 million; adjusted operating income increased 10% to a record $242 million
Operating Expenses: Decreased to $514.5 million from $515 million
Operating Ratio: Worsened 10.4 points to 76.2% from 65.8%; adjusted operating ratio improved 1.6 points to 64.2% from 65.8%
Click here to read KCS’s full earnings report.
Net Earnings: Increased 23% to $677 million from $552 million
Earnings Per Share: Diluted earnings per share increased 30% to $2.51 from $1.93
Revenue: Increased 5% to a first-quarter record of $2.8 billion from $2.7 billion
Operating Income: Increased 16% to a first-quarter record of $966 million from $835 million
Operating Expenses: Decreased by $8 million to $1.874 billion from $1.882 billion
Operating Ratio: Improved to a first-quarter record 66.0% from 69.3%
Click here to read NS’s full earnings report.
Net Earnings: Increased 6% to $1.4 billion from $1.3 billion
Earnings Per Share: Increased 15% to $1.93 per diluted share from $1.68 per diluted share
Revenue: Decreased 2% to $5.4 billion from $5.5 billion
Operating Income: Increased 1% to $2.0 billion from $1.93 billion
Operating Expenses: Decreased 3% to $3.4 billion from $3.5 billion
Operating Ratio: Improved 1.0 point to 63.6% from 64.6%
Click here to read UP’s full earnings report.
Net Earnings: Decreased to $38.8 million from $76.0 million
Earnings Per Share: Diluted earnings per share decreased 42.9% to $0.68 from $1.19
Revenue: Increased 2.1% to $332.4 million from $325.6 million
Operating Income: Decreased 5.3% to $69.3 million from $73.2 million; adjusted operating income decreased 4.2% to $70.3 million from $73.4 million
Operating Expenses: Increased to $263.1 million from $252.5 million
Operating Ratio: Worsened to 79.1% from 77.5%; adjusted operating ratio worsened to 78.9% from 77.5%
Click here to read G&W’s full earnings report.
Notes:
- Operating ratio is a railroad’s operating expenses expressed as a percentage of operating revenue, and is considered by economists to be the basic measure of carrier profitability. The lower the operating ratio, the more efficient the railroad.
- All comparisons are made to 2018’s first-quarter results for each railroad.
- Figures for G&W are for North American operations only, with the exception of Net Earnings & Earnings Per Share, which includes all G&W operations, as solely North American figures were unavailable in these categories.
- All figures for CN & CP are in Canadian currency, except for earnings per share for CP


 A notice of a meeting of the Surface Transportation Board’s (STB) Rail Energy Transportation Advisory Committee (RETAC) appeared in the
  The Social Security Board of Trustees released its annual report on the long-term financial status of the Social Security trust funds. The combined asset reserves of the Old-Age and Survivors Insurance and Disability Insurance (OASI and DI) trust funds are projected to become depleted in 2035, one year later than projected last year, with 80% of benefits payable at that time.
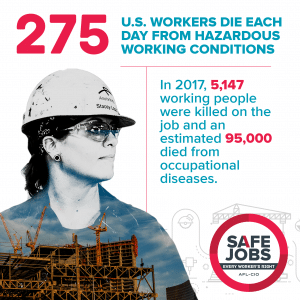
 With Workers’ Memorial Day (April 28) almost upon us, the AFL-CIO today released their annual report on deaths on the job. This year’s focus of the report was workplace violence.
 The Occupational Safety and Health Administration (OSHA) has announced that there will be a public meeting to solicit comments on its Whistleblower Protection Program from 1 – 4 p.m. EST May 14, 2019.
 The U.S. Department of Transportation published a final rule April 23 that makes technical corrections to regulations governing drug testing for safety-sensitive employees to ensure consistency with recent amendments made to DOT’s “Procedures for Transportation Workplace Drug and Alcohol Testing Programs,” which recently added requirements for testing for oxycodone, oxymorphone, hydrocodone and hydromorphone.
